
Infographics, Dataviz, and Report Design: a Client Case Study
Have you ever wanted to create an infographic?
…Or, maybe you’ve wanted to design a nice research or evaluation report?
…Or maybe you’ve wanted to improve your data visualization skills.
But maybe you didn’t know where to start.
Here is my surprising recommendation: don’t start with any of them.
Instead, I recommend that you start by learning how to create engaging presentations.
Whoa, I know.
That probably feels like it came out of nowhere.
But I often talk about how learning effective presentation skills translates directly into creating better data visualizations, infographics, and reports.
That’s why I wanted to share an example of some infographics, data visualization, and report design work I did for a client.
Just in case you’re new to my blog, I’m Dr. Echo Rivera and I specialize in presentation design and training for academics, evaluators, scientists, and researchers.
I’ve always prioritized my presentation skills above report design, dataviz, and infographic design. That’s because presentation skills are actually effective communication skills and are much broader than just “slide design” or “PowerPoint” skills.
An unexpected bonus from developing my presentation skills was that I translated those skills into other creative research communication products.
I put together this post so I can show you real life example of what my presentation skills were able to help me accomplish for this infographic and report design project (which includes data visualization).
About the design project and the client
Natalie Claiborne and Amy Royer from the Montana Office of Rural Health at Montana State University reached out to see if I could help with a data visualization, report design, and infographic project.
Part of their work involves conducting community health needs assessments (CHNA) and implementation plans with hospitals. This is an ongoing project and their team is responsible for creating 100+ page reports to share the data with the hospitals, community, and the public.
Whoa! That’s a lot of data!
They reached out to see if I could help make these reports and data visualizations more visually appealing and easily digestible. They were hoping for a way to streamline the process with a new template that could be used multiple times.
More than helping their team save time, they really wanted to make reports that were more accessible and reader-friendly to a broad audience.
After that call and reviewing the materials they sent, one thing became pretty clear to me: they were already doing a lot of work to improve the visual design and digestibility of their work.
Their data visualizations were easily above average (clean, no clutter, great color choices) and they were already doing visual summaries (2 page infographics) of the reports.
Here’s what the project involved:
Infographic redesign (before/after makeover)
Data visualization redesign (before/after makeover) + design new graph templates
Report design layouts & basic template
Infographic Before/After Makeover
Task: Redesign of one of their infographics.
Goal: Create a standard design they could apply across infographics, as well as share some ideas for data visualizations (quant and qual).
Tool: PowerPoint + Excel for the dataviz. For the original, they used an online app and weren’t thrilled with it, and were open to using a new app. PowerPoint is so easy to use and can make great infographics—plus, it’s a program they were already familiar with and wouldn’t involve learning a new app.
Here is the infographic sent to me, the “before”.
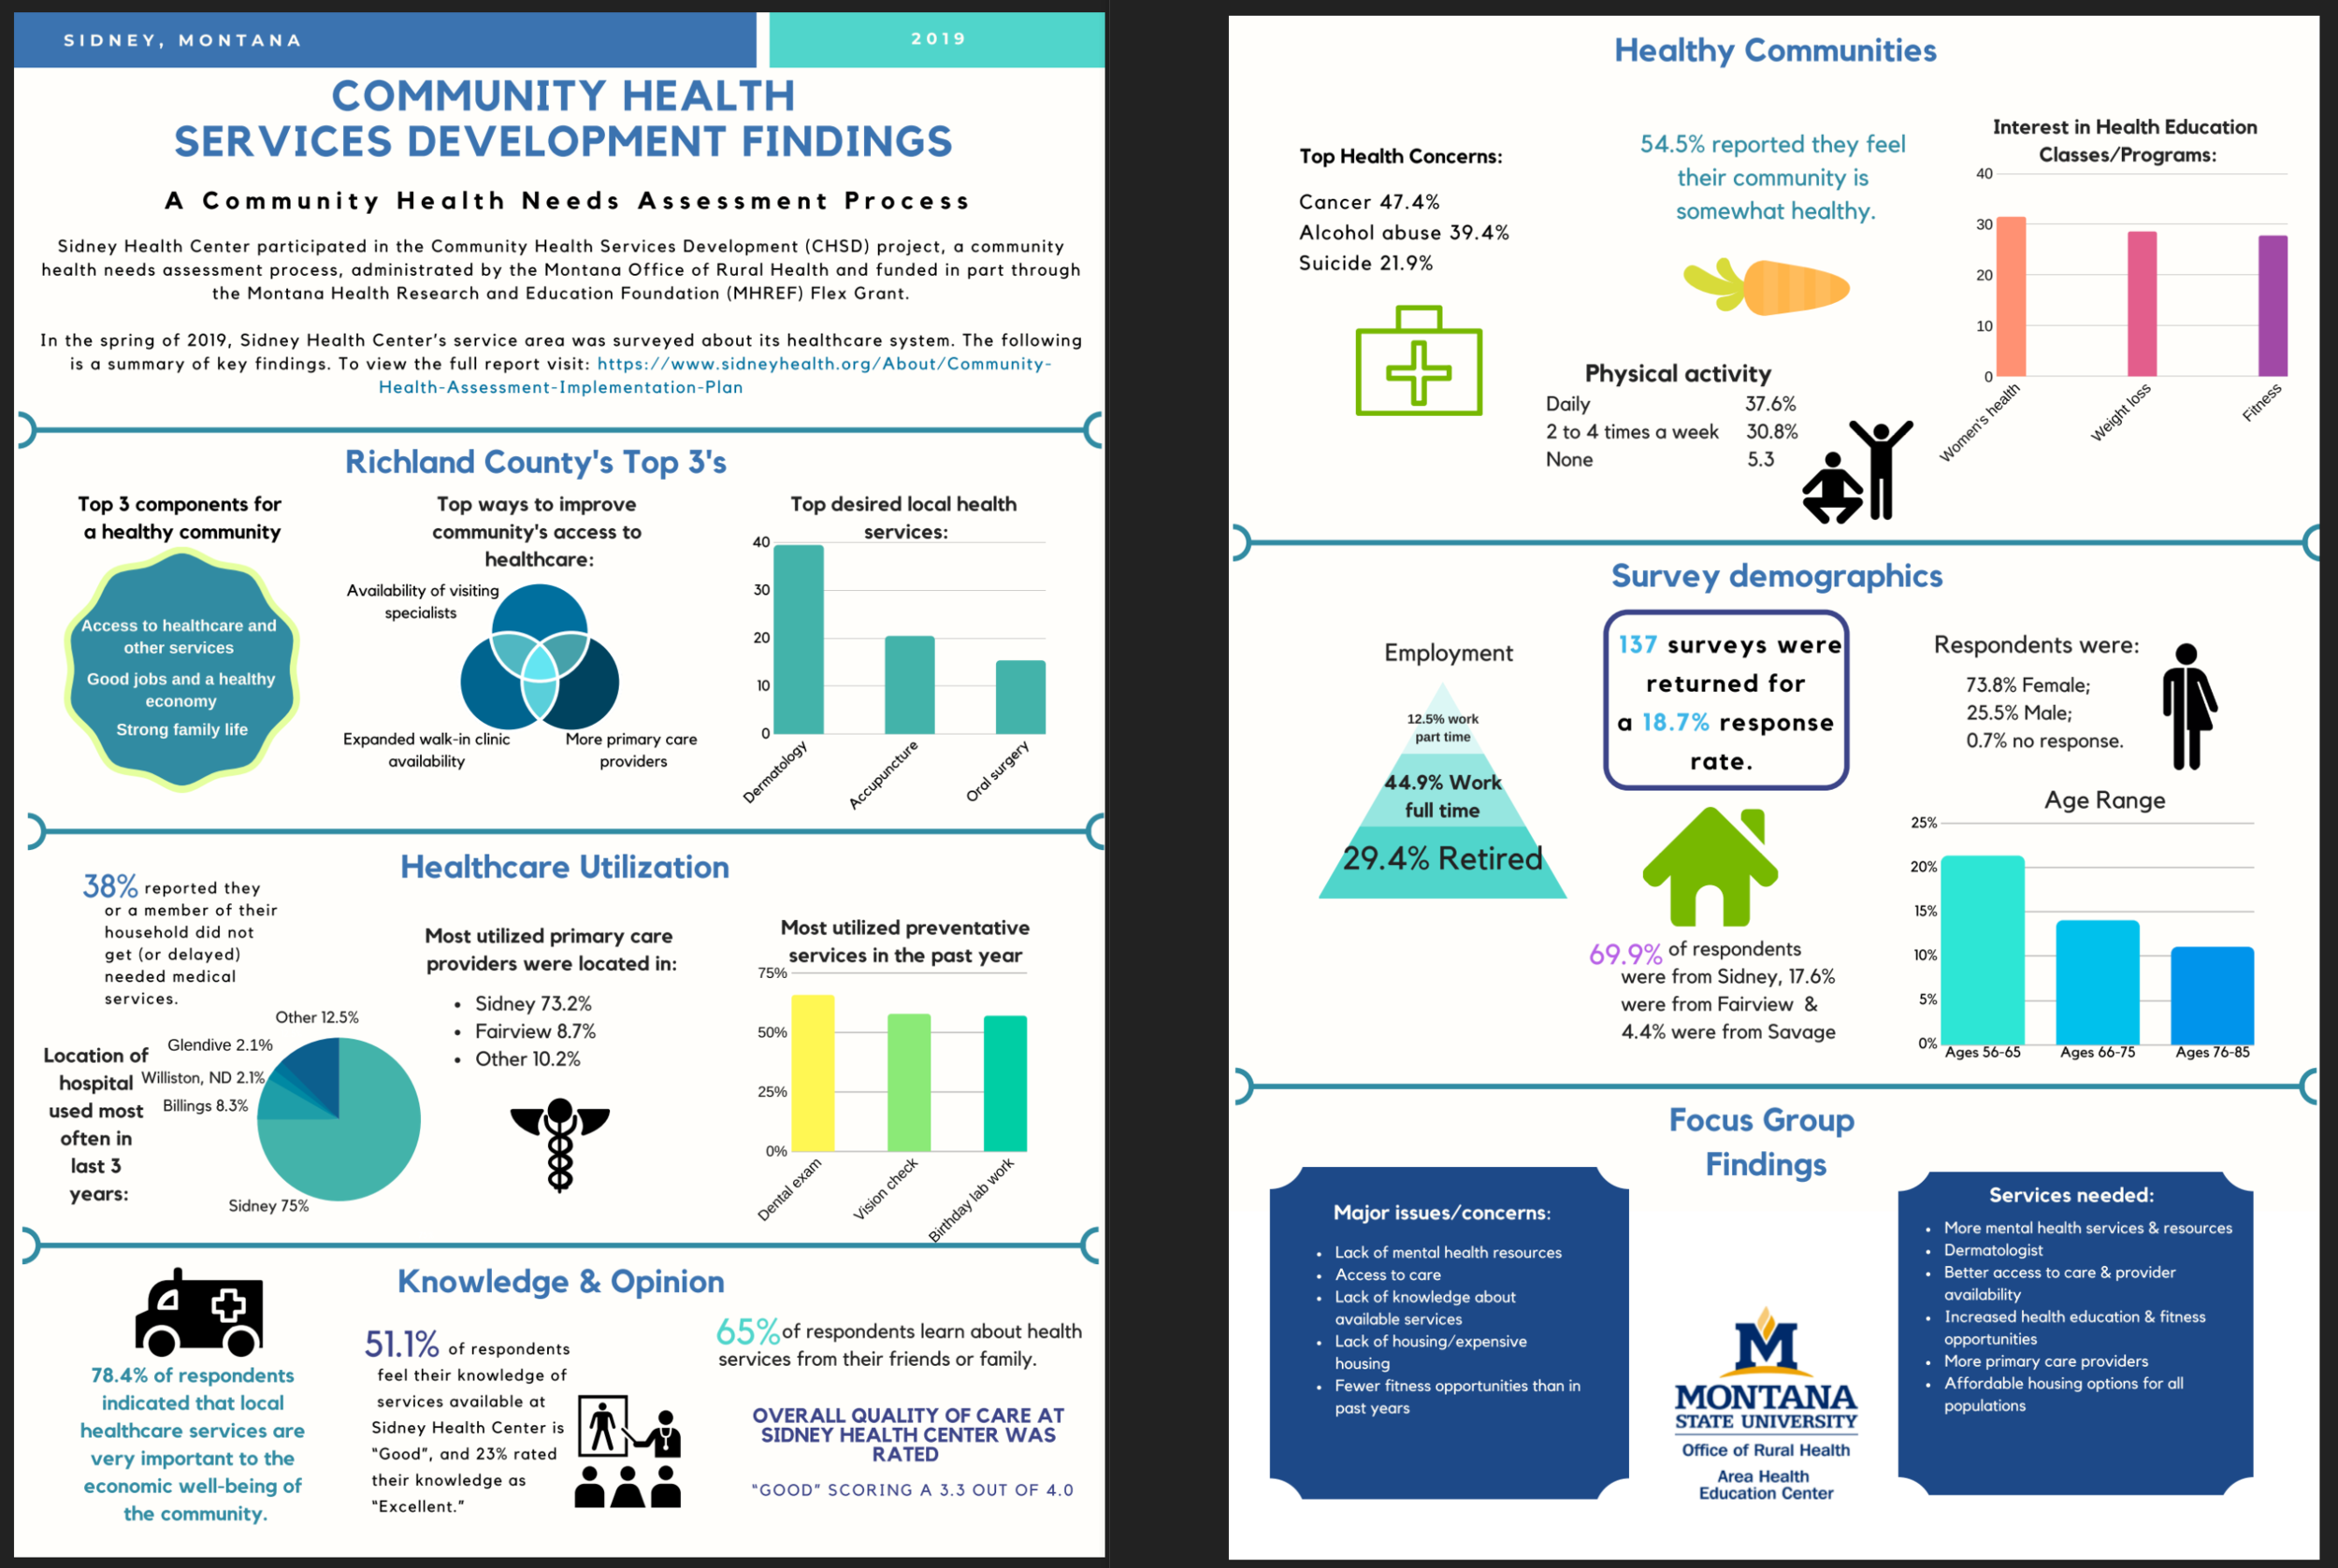
BEFORE
The fact that they were able to take a 100+ page report and condense it into two pages is fantastic. Plus, they applied several design strategies already. The headings were clear and each section was clearly defined. It’s also highly visual and not a giant wall of text.. Finally, when taking a closer look at the information shared here, it’s actually really helpful and relevant information.
Because of the strategies already implemented by the client, this was a relatively easy draft for me to work with. I didn’t need to work with them to overhaul the information shared (i.e., the storyboard). It mostly just needed an updated design.
Key areas I wanted to improve:
Core design elements (alignment, consistency, placement, contrast)
Color choices for the dataviz, including emphasizes key points when possible
Ensuring all visuals were included for a purpose (i.e., no decorations or clutter)
So, here is the after:
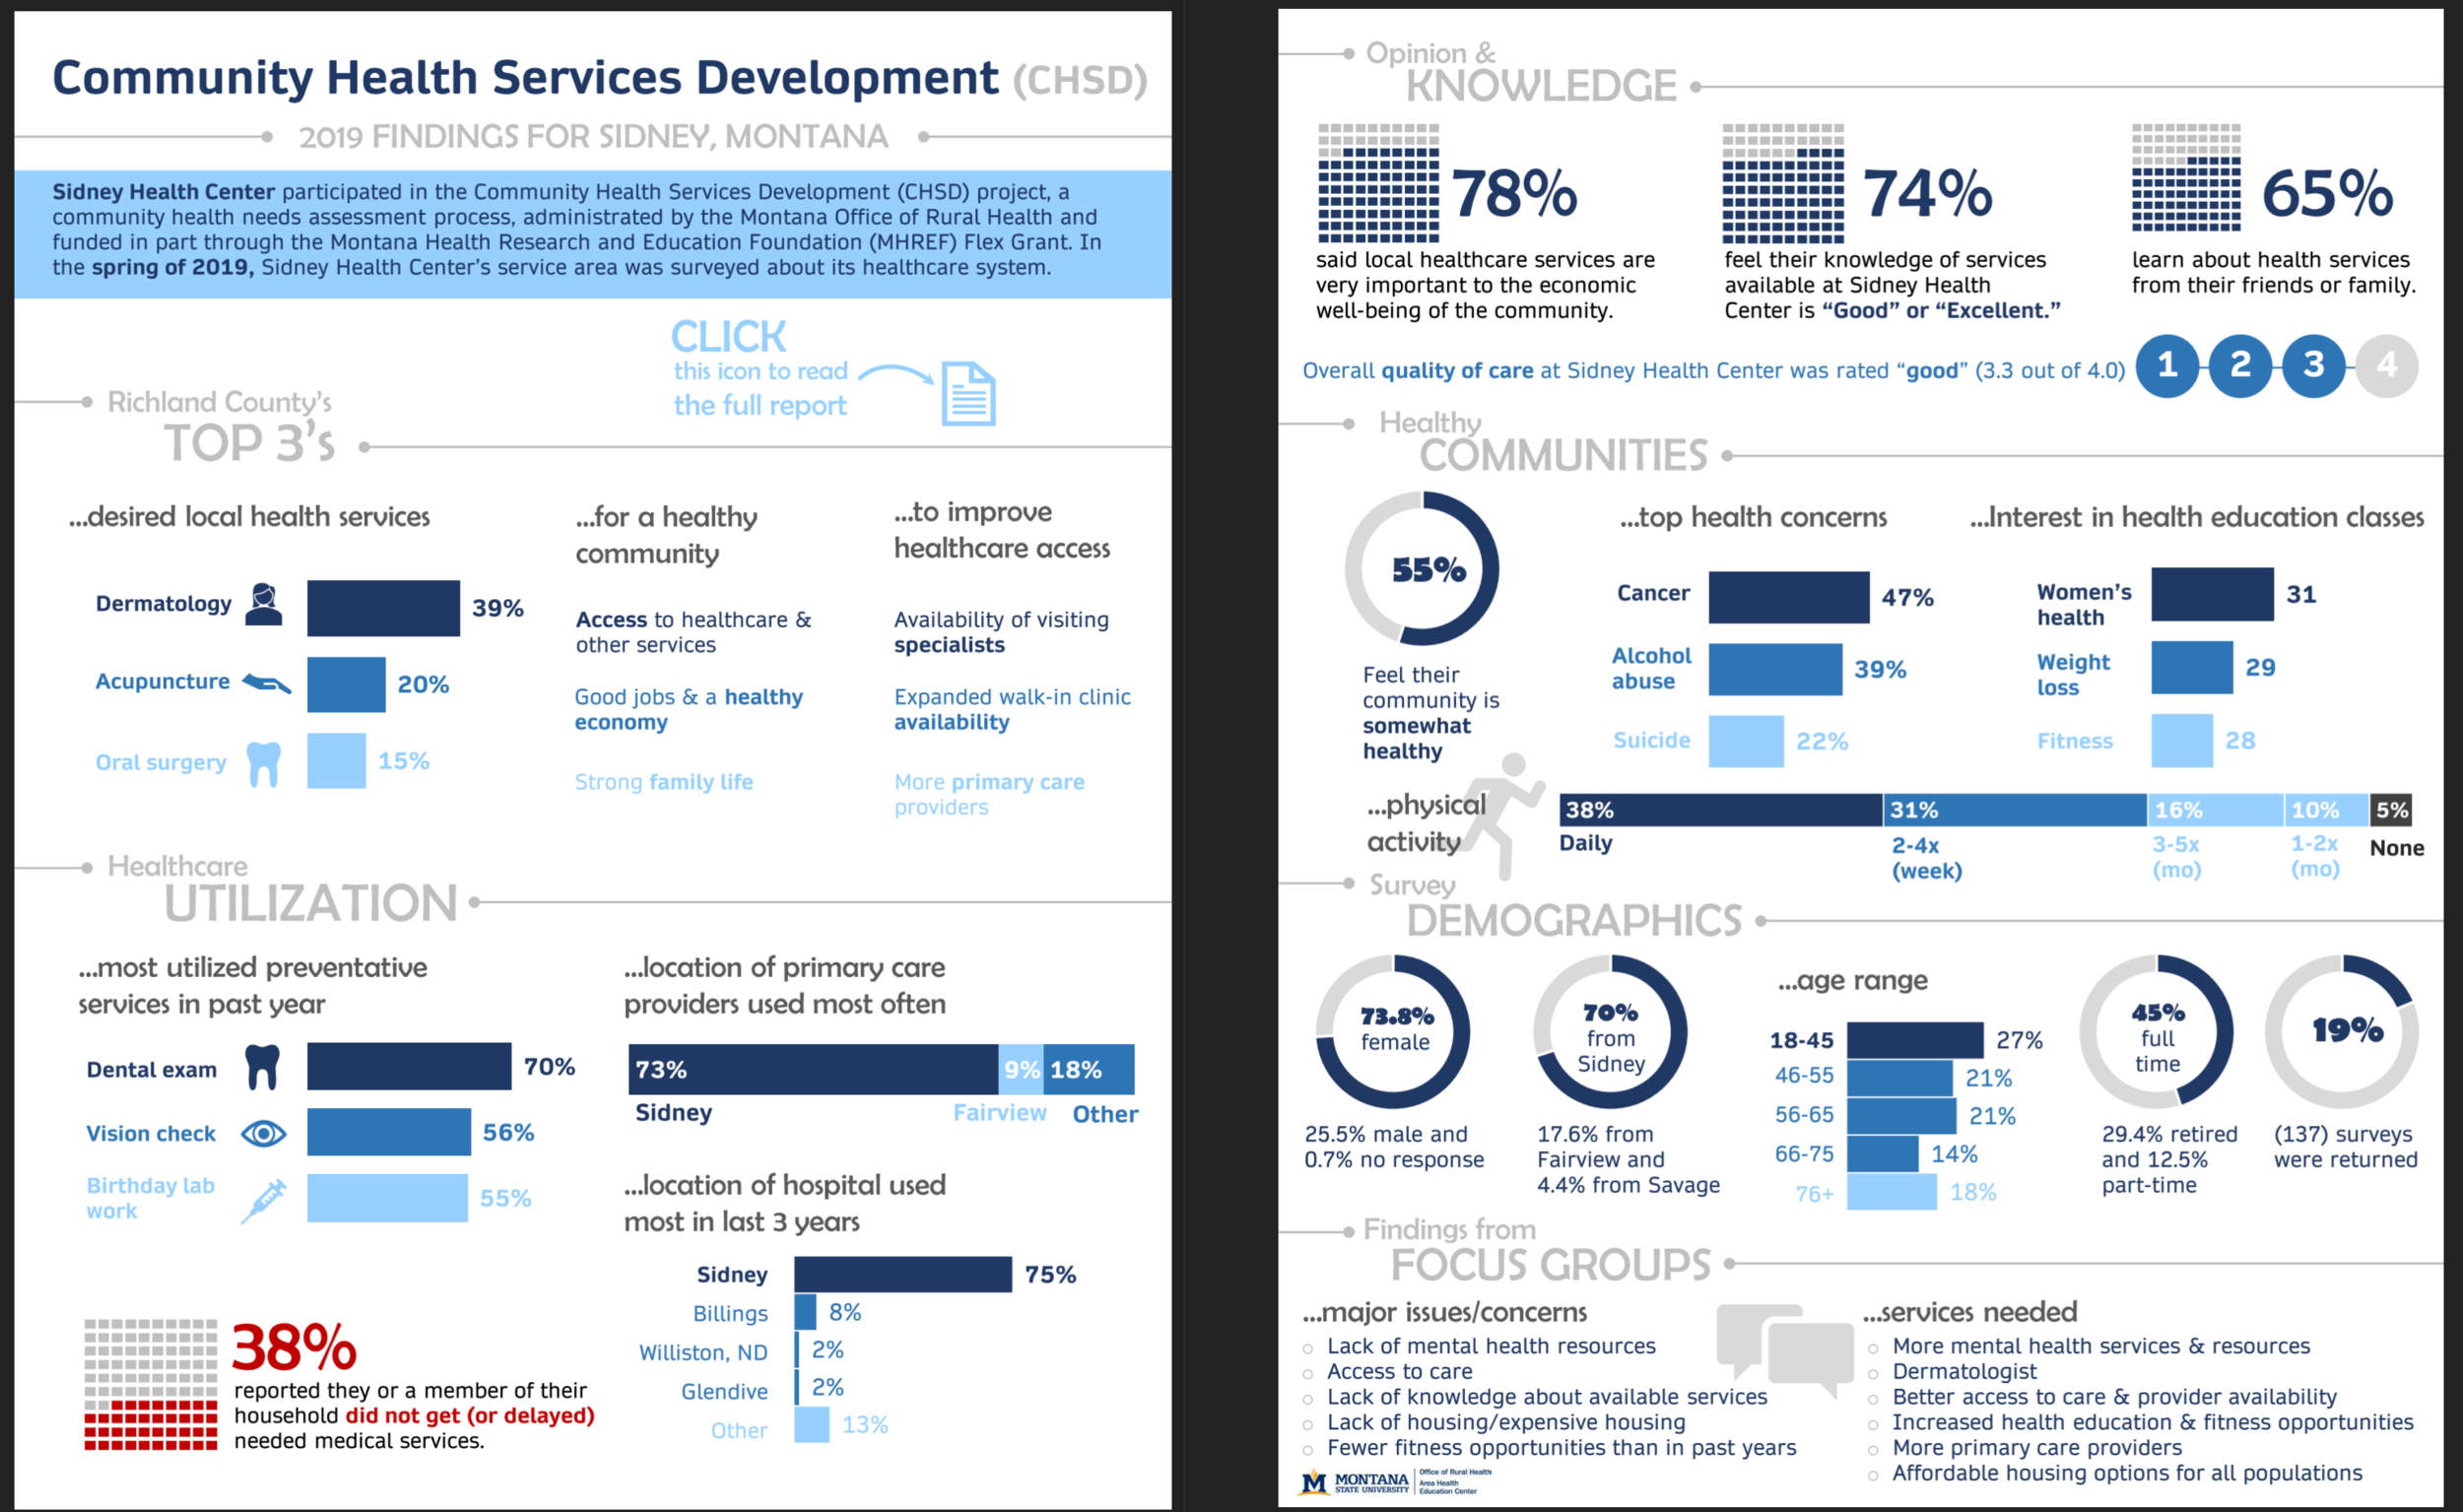
AFTER
What do you think?
I applied several professional design strategies to create this version. I used alignment, color, contrast, placement, dataviz design, and more to create this infographic.
All of which are strategies I apply to presentations, so it was easy to do.
Beyond that, I noticed there was some data missing in the original, which told an incomplete story. Through a video session I asked for this additional information and added it.
The “After” version actually has more information than the first. Yet, because of the information & data design strategies I used, it looks more inviting and less overwhelming at a glance.
People are often surprised that I use PowerPoint to make infographics, but it really is my go-to tool, especially when working with clients who are already familiar with PowerPoint.
Which is another reason learning presentation skills can be so helpful for creating infographics (PowerPoint is my #1 recommended app for slide design, too).
Yes, I can use Affinity Designer too but if there will be dataviz then it’s better to use PowerPoint so you can use Excel, too.
Data Visualization Makeovers
Task: Redesign four of their current graphs and create four new graphs.
Goal: Build internal capacity for creating excellent data visualizations after the project. I would provide a report of recommendations, instructions, and additional training on how to adjust these graphs, and for alternative graphs to use.
Tool: Excel, so they could be saved as templates and applied to future graphs.
Here are some screenshots of that report, which show both the before and after on a single page.
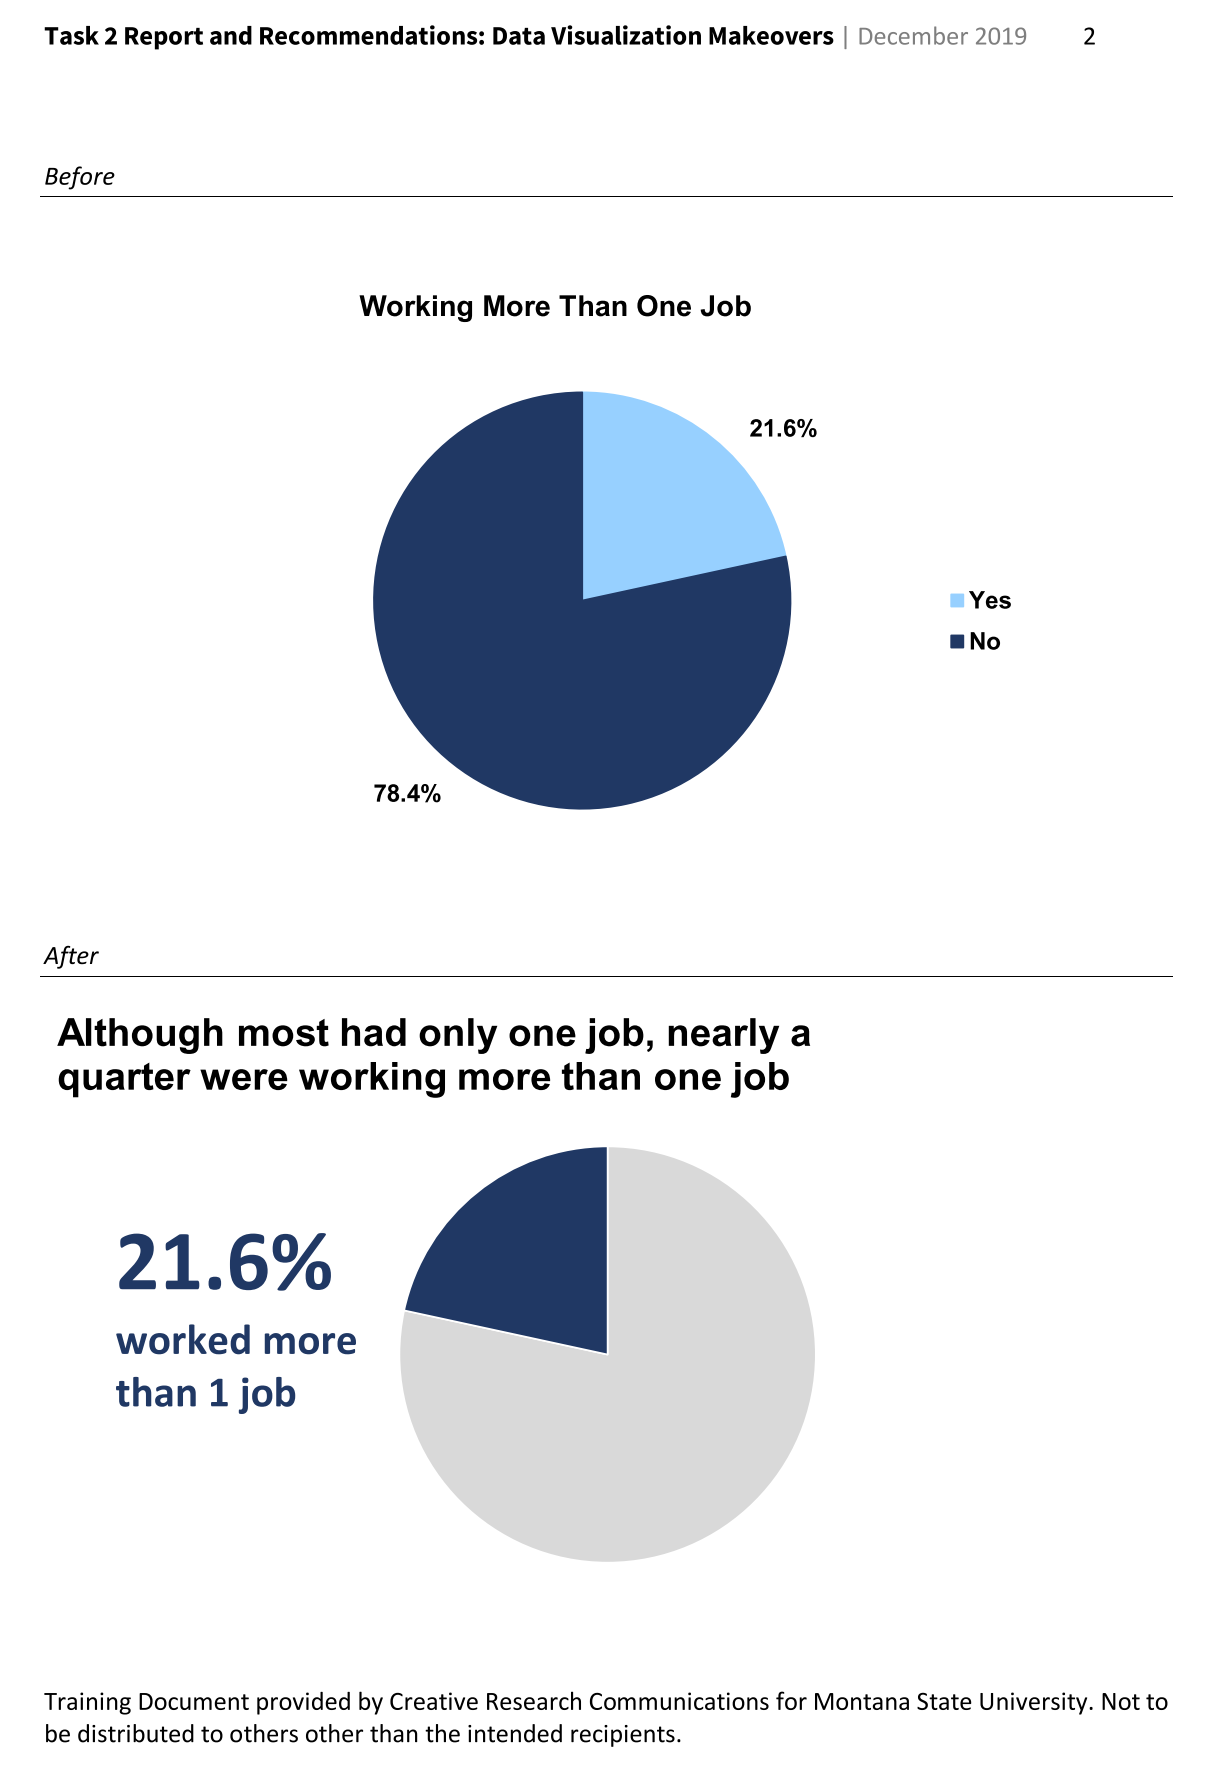
I know a lot of people hate pie charts, but I am not one of them. The client used them frequently, so I made sure to redesign one of their pie charts to provide tips on how to make them more effective.
Here’s the before/after for that redesign:
Clustered bar charts: another common graph you see in evaluation reports.
They definitely work in a lot of situations, but for this situation I recommended a simple stacked column chart instead. Here’s that before/after redesign:

Take a moment to compare the difference between the two.
Do you see how using a stacked bar made it easier to see – at a glance – that this data is “part to whole” (yes/no) and it was easier to understand the actual percentages?
I also used direct labeling in the redesign, which makes it even easier to know which section represents yes vs no. We’re looking at data over time, so it’s easier in the “after” to see things like relative fluctuations in the percentage who did not receive hospital care (i.e., that there was a bump in 2016, but that this went down in 2019).
Once again the client used a clustered column graph and I wanted to show another way to represent this data. In this case, I used a line graph. I also showed them how they could use the combination of color + gray to highlight specific years.

Again, I encourage you to take a moment to compare the two so you can see the improvement. At a glance, it’s easier to tell that we have longitudinal data—line graphs are intuitive that way. We can more easily see change over time, as well.
Okay so we have another clustered bar graph, but this time it’s more than a simple yes/no variable here. We’re now looking at frequency of physical activity with multiple category options. This is a lot of data to include in one graph, so I went with a horizontal stacked bar chart. I also made sure we eliminated all vertical text.
Here’s the before/after redesign:
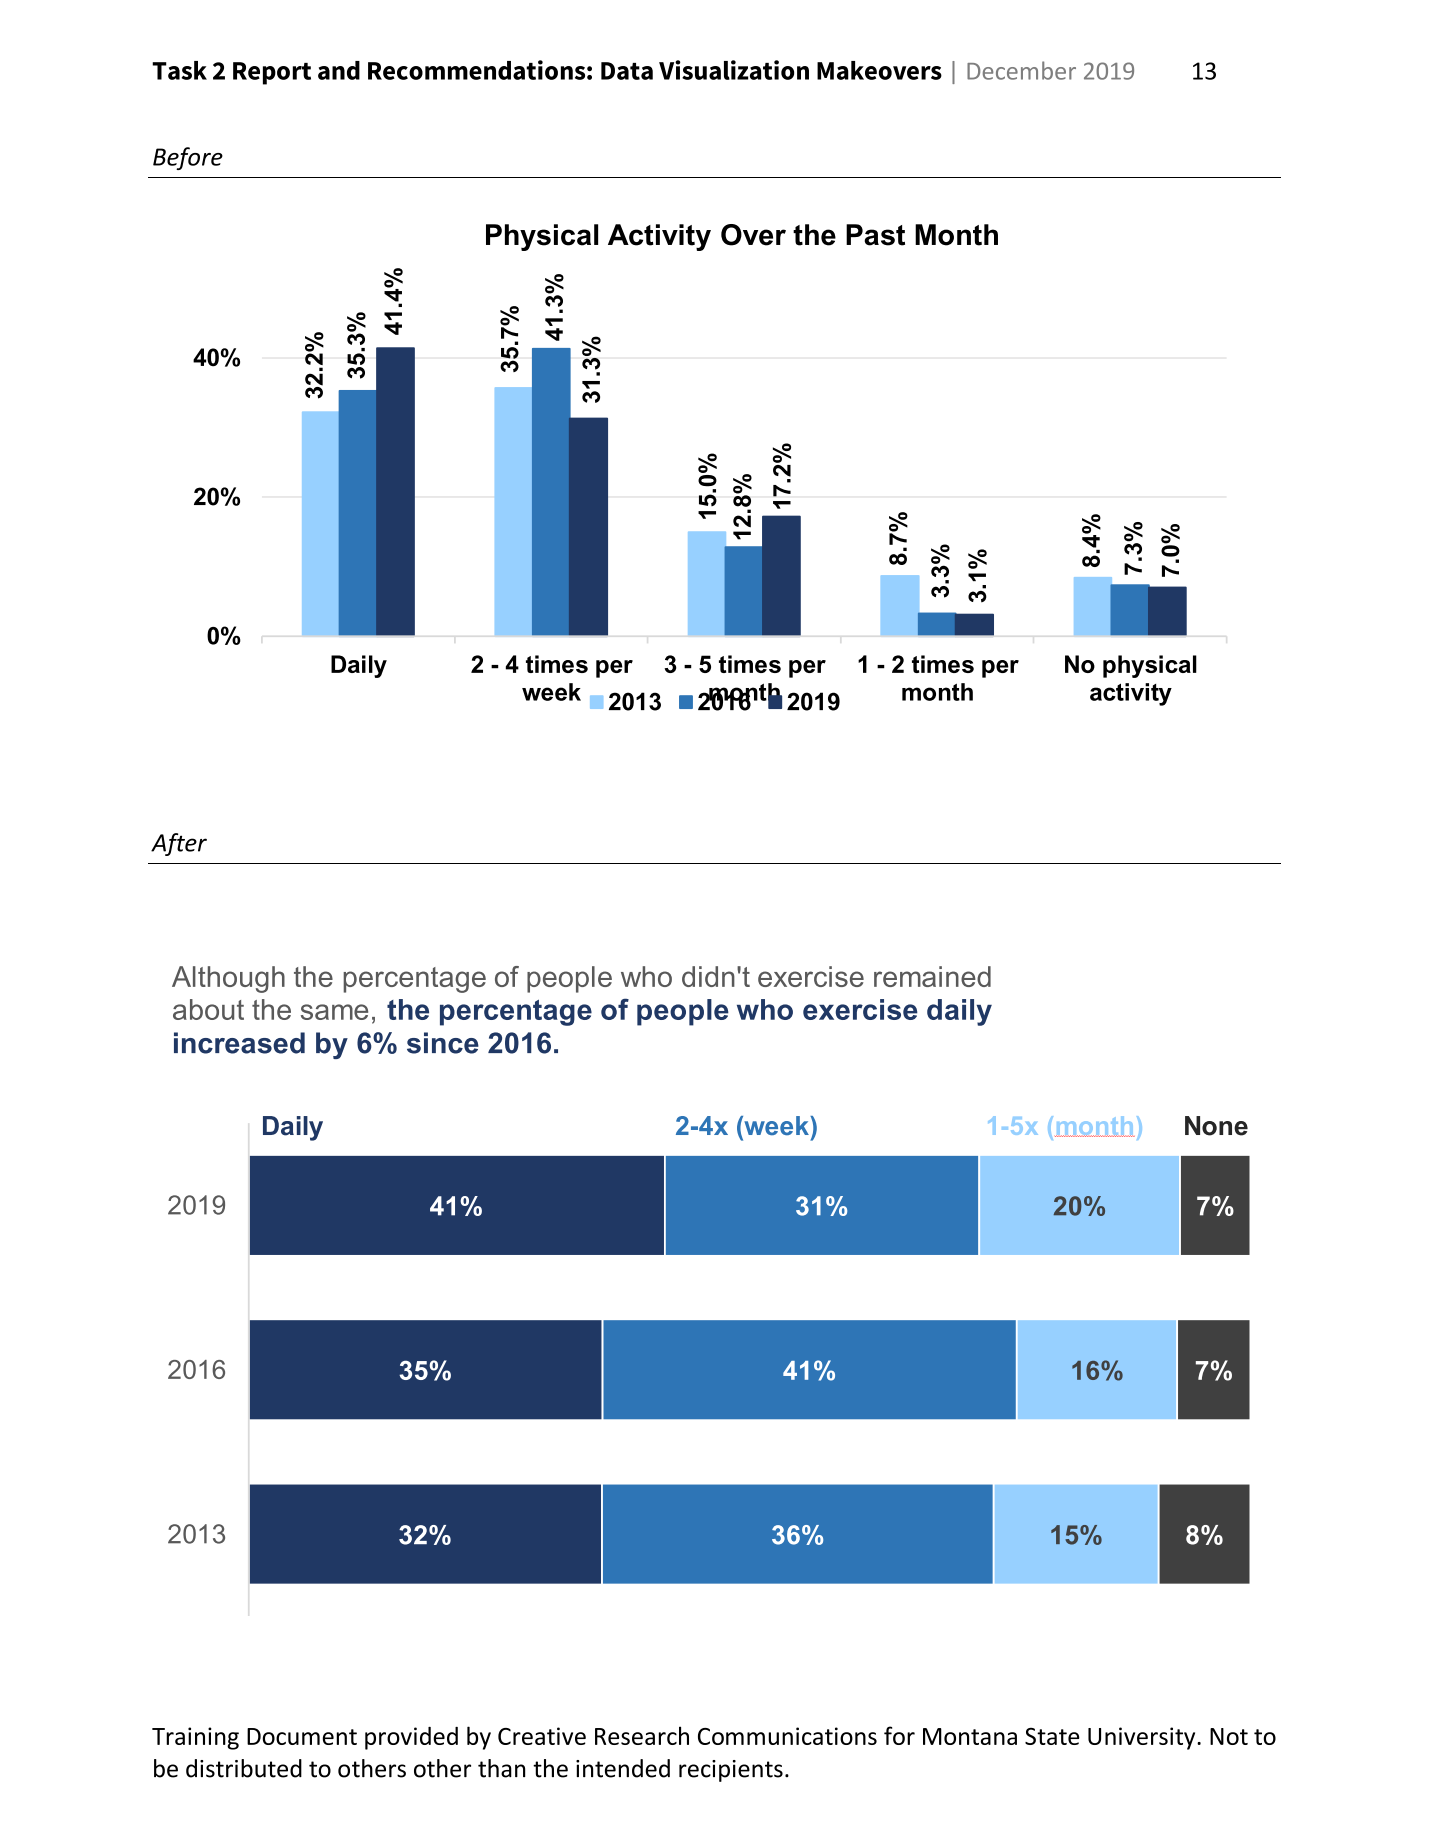
This might have worked just fine as a vertical stacked bar chart, but my goal with this project was to give the client options and ideas. Most people I work with tend to get stuck with 1-3 graphs, and will use them over and over again. So, I wanted to show an example using a horizontal stacked bar chart.
Do you see how it’s easier to see change over time and make comparisons using the stacked bar chart option? For example, if I were you ask you “which year had the highest percentage of daily physical activity?” Which graph helps you answer that question the fastest?
And finally, we had some Likert-type scale data to visualize. The original was a clustered bar graph and, again, I probably could have used a stacked bar chart but I wanted to give the client options.
Here’s the before/after redesign:

Again, it’s important to remember that the client has longitudinal data to work with and wants to be able to compare data over time. In this case, I wanted to show how the client could emphasize change in one category at a time.
The downside of the stacked bars I showed above is that sometimes the middle categories can get washed away or hard to compare across time points or categories. With this approach, you could just look at how “good” changed over time in an easy way.
All of the skills I used to create data visualizations for their reports are the same skills I use to present data effectively with slides. It was super easy to translate that knowledge into static data visualizations.
Report Layouts + Report Design Tips
Task: Create as much of a template as I possibly could to help them with future report design.
Goal: Set up heading styles and creating elements they could copy/paste/customize. Specifically, I set up heading styles in Word, created a simple design for them to use as “new section” pages, and created callout boxes.
We also decided that I would take four pages from their existing report and redesign them to create layouts they could use in the future. They chose the pages based on their biggest struggle points:
What to do when there is just one graph and a little bit of text?
How to share qualitative data in a visual way?
How to use tables in effective and visual ways?
How to design pages that are all text in an effective way?
Tool: Microsoft Word
The first thing I noticed is that there were no pages to indicate the reader was in a new section. While shorter reports can sometimes get away with this, a 100+ pages report really needs something like this.
So that’s the first thing I did. I kept it simple: great image, title, and icon. That’s it. But it stands out and helps break up the report.

AFTER (there was no “before”)
And yup — that’s a strategy I learned for my presentations years ago.
Ok what’s next. Ah. A data table.
(long sigh). Tables, am I right?
They can sometimes feel like most boring way to share data, but it’s hard to know what else to do! This was a big struggle point with the client, which is why they included a page with a big table as one of the layouts for me to redesign.
Here is the before page they sent. And just to add an extra challenge, they said they wanted to see a redesign that included three years of data (this one includes two!).

BEFORE
Is it even possible to add that much more data without making this overwhelming and something that turns people away?
Absolutely!
The first thing I did was break up this information into 2 pages instead of just 1 page. The first page includes the details (and a callout box to emphasize the key points).
They have plenty of room if they want to add more detail (or change the position of the callout box).
This meant we could use a full page just for the table with three years of data – AND I even added an extra column!

AFTER
Another column?! You mean I added even more information than the original?
Yup!
Because, the client mentioned they wanted help with creating reports that more digestible. Something where it’s (relatively) easy to get the key points. That’s a perfect time to use something like an indicator or summary column. In this case, the column says “increased” and a simple box shaded in or not would indicate whether or not this category increased. This could also be used to represent something like statistically significant, decreased, completed, or other markers of interest to readers.
So, hopefully this demonstrates that tables don’t have to be boring or unengaging. Tables are an important way to share data that readers need and they can look nice when you use design strategies to create them.
Of course, whenever possible you don’t want a report that is only tables. So, what happens when you want to take a table of data and create graphs for it? A lot of people struggle with doing this.
The client was struggling with one set of data in particular: survey respondents reported on the reason they chose their clinic/service provider and there were about 12 options. Plus, this data was available across 9 different communities. Meaning, we had some cross-tab data.
One way to address this challenge is by using small multiples. Here’s the before:

BEFORE
And here’s the after.

AFTER
I didn’t try to cram this all into one graph. Instead, I used small multiples.
All the communities are listed in the exact same order and in the exact same spot, which allows for comparisons from graph to graph. I also showed them that they could use this for either counts or percentages, whichever they prefer. This could have been organized in the reverse way, too. The idea I was showing the client here was using small multiples to present cross-tab data.
What about qualitative data? How do you avoid walls of text?
Here is the page with qualitative data that the client chose for the redesign. The client already did some great things here, including using a photo and icons to add visuals.

BEFORE
Those are the key first steps to sharing qualitative data in more visually engaging ways. I took that to the next level by choosing a new image and applying several design strategies at once to make this engaging to the reader. Here are the redesigned layouts:

AFTER
Is it a lot of text? Yes. Qualitative data often involves a lot of quotes and that’s just the way it is.
While there are absolutely other options for visualizing qual data, I kept in mind that the client had to generate reports of this magnitude several times each year, with different communities. The idea was to keep this simple and sustainable. Icons + well-designed quotes/key points is a simple and sustainable strategy.
Also, did you notice that I used all of the same icons the client already chose? This was another reason I found it so easy to work with the client on this project—they already made some excellent choices that I was able to edit, adjust, and build on. This also shows how seemingly-simple design strategies like color, size, and placement can actually make a big difference!
Next: What about evidence matrices or summary tables? This was another area that the client struggled with, like many others I’ve worked with. Here is the page they chose for a redesign:
These reports have tons of data, across multiple years, and from a variety of sources. If you want a report like this to be digestible for a variety of audiences, then a table like this is absolutely necessary. It was great to see something like this in the original report, and the client wanted to make this more visually appealing.

No problem! I knew just what to do. Here’s the after:

Once again, the idea is to move the intro statement and details to a previous page so we can use the entire page for this table. I first applied several design strategies to clean up and organize this table. That way the table feels light and inviting. Instead of using a checkmark for all 3 columns, I used 3 different symbols. That makes it easier for the reader to keep track of what type of data type corresponds with which row (topic). Plus, if the client wanted, they could use those symbols throughout the report to reinforce the different data sources used in the report.
Alrighty. That’s the project!
I wanted to share this with you because it’s a great example of how presentation design skills can end up helping you create better reports and infographics.
The core thinking is the same for all of them: how do I share this information in ways that will engage the audience and help them understand.
That’s just one reason it’s worth your time to develop presentation skills.
That’s also why my presentation training always includes strategies on how to understand your audience better so you can achieve those goals.